What is Document Similarity?
Document similarity measures how similar two documents are in terms of content. It takes into account the number of words or phrases that appear in both documents and uses algorithms to calculate how closely related they are. This can be used to compare two different versions of the same document or two completely different documents. The higher the score, the more similar the documents are considered to be.
What is Quality Score?
Quality score is an assessment of the overall quality of a document. It looks at various factors such as grammar, readability, structure, relevance to topic etc., and assigns it a numerical value based on these criteria. A higher quality score means that the document meets higher standards in all these areas while a lower quality score indicates lower levels in some or all of them.
The Benefits Of Document Similarity & Quality Score
Using document similarity and quality scores can provide helpful insights into how well your content meets certain standards. For example, if you have multiple versions of a document you can use document similarity to quickly identify which version has more relevant information compared to others or which version has been modified more recently than another version. Additionally, using quality scores helps you determine which versions meet certain standards for readability or structure so that you can make sure your content is up to par with industry standards before publishing it online or sending it out for review by stakeholders.
Conclusion:
Document similarity and quality scores provide powerful tools for data geeks who want to make sure their content meets certain standards before it goes out into the world. By looking at both metrics together you can quickly identify which versions have more relevant information or meet certain criteria over others. With this knowledge you can then make sure your content meets industry standards before publishing it online or sharing it with stakeholders so that you can ensure its success!
Document similarity is a measure of how similar two documents are to each other. One way to represent the similarity between two documents d1 and d2 is to use a similarity vector.
A similarity vector is a numerical representation of the similarity between two documents. It is typically a list of values that indicate the degree of similarity between the documents on different dimensions or features. For example, a similarity vector for two documents d1 and d2 might include values for the similarity of their content, style, structure, and so on.
To compute a similarity vector, you need to define a set of features or dimensions that you want to use to measure the similarity between the documents. You can then use a similarity measure, such as cosine similarity, to calculate the values for each dimension.
To calculate the values for each dimension, you could use a similarity measure such as cosine similarity to compare the content of the two documents and another measure like Jaccard similarity.
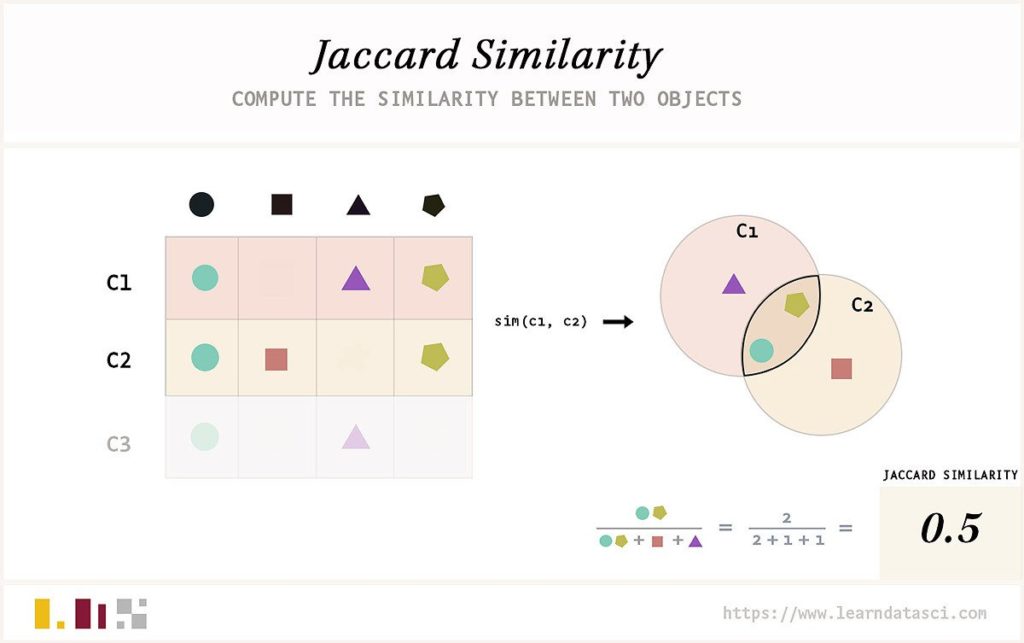
Jaccard similarity
is a measure of the similarity between two sets of data. It is calculated by dividing the number of elements in both sets that are shared by the total number of elements in both sets. This metric has been successfully used to compare text documents, as it takes into account only those words present in both documents, disregarding those Jaccard similarity to compare their styles.
Once you have calculated the values for each dimension, you can use the similarity vector to compare the overall similarity between the two documents. For example, if the content_similarity value is high and the style_similarity value is low, you might conclude that the documents are similar in terms of content but not style.
On the other hand, if both values are high then you could conclude that the documents share similar content and style.
In addition to using similarity measures to compare documents, you can also use them in a more general sense to measure how much two documents differ from each other. For example, you can use cosine similarity to calculate the difference between two documents in terms of their content and style. This measure can be used to identify how two documents compare on various levels, such as the overall amount of content they share, the type of language they use, and even the level of complexity within the documents. By comparing these values, you might be able to determine if two documents are related or not
Phrase queries
The representation of documents as vectors is fundamentally lossy: the rel- ative order of terms in a document is lost in the encoding of a document as a vector. Even if we were to try and somehow treat every biword as a term (and thus an axis in the vector space), the weights on different axes not in- dependent: for instance the phrase German shepherd gets encoded in the axis german shepherd, but immediately has a non-zero weight on the axes german and shepherd. Further, notions such as idf would have to be extended to such biwords. Thus an index built for vector space retrieval cannot, in general, be used for phrase queries. Moreover, there is no way of demanding a vector space score for a phrase query — we only know the relative weights of each term in a document.
On the query german shepherd, we could use vector space retrieval to iden- tify documents heavy in these two terms, with no way of prescribing that they occur consecutively. Phrase retrieval, on the other hand, tells us of the existence of the phrase german shepherd in a document, without any indi- cation of the relative frequency or weight of this phrase. While these two retrieval paradigms (phrase and vector space) consequently have different implementations in terms of indexes and retrieval algorithms.
Combined usefully, phrase and vector space retrieval can be powerful tools for retrieving relevant documents and identifying relative frequencies of search terms. For example, if we were to search for the term “German Shepherd”, we could use a combination of both phrase and vector space retrieval to find documents where this term is frequently used. By usingcombined usefully, phrase and vector space retrieval can help to identify related terms such as “German Shepherd Dog”, which may be more relevant to our search. In addition, the relative frequency of each term can be used to assess its importance or relevance in relation to other terms. This type of analysis could also be used to identify phrases that are synonymous with a given term. For example, a search for “dog” could also return the phrase “canine companion” and other related phrases. By making use of these types of techniques, we can refine our searches to more accurately capture what we are looking for while avoiding irrelevant results. Additionally, by utilizing frequency analysis, we can better distinguish between the most important terms in a query and those that are less relevant. This can be especially useful for more complex queries, where multiple terms often need to be combined to accurately represent the desired results. By leveraging frequency analysis and other types of term-based analysis, we can significantly improve our search results and ensure that we find exactly why Google is placing certain domains on top three.
Content Content Quality Score (CQS)
Quality Score (QS) is a metric used by search engines to measure the relevance of content on websites. It is based on numerous factors such as keyword optimization, text structure, readability, and user engagement. The CQS Search3w’s invention patent helps determine which pages are most relevant for certain queries and should be displayed higher in the search engine
It is not possible for any software or online service to accurately assess the overall quality of a piece of content. Instead, various independent factors such as uniqueness, writing level, and repetition must be considered separately.
Search3w software analyzes ten different factors to determine the quality of a webpage or piece of text include Spell Check & Grammar, Punctuation, Duplicate Content across the web, Readability, Domain Authority and Language factors.
The challenge is that each of the 10 factors used to determine the quality of a webpage or text can return a range of numbers with different scales. For example, some factors may return a score between 0 and 1, while others may have a score greater than 1000. To address this issue, a normalization formula is used to align the factors into a score that is easy for humans to understand. This is similar to the task of making a sandwich where the bread slices are different sizes, one slice is 10cm, the other is 30cm, and the cheese is only 5mm. To make a regular sandwich, you would need to use a normalization formula to align the sizes of the different components, in this case, CQS Normalization.
Our research and testing revealed that when Xmin is too low (but not less than zero), we found it necessary to apply a damping factor of 0.8.
The calculations were based on a factoring decision table that utilizes normalization theory. The weight in this case, refers to the importance of each factor in determining the overall score.